Welcome to the documentation for PE_parameter_selection
This page provides a summary of the Python functions used in “On the Automatic Parameter Selection for Permutation Entropy”. To use this package, the following python packages are needed:
numpy
scipy
pyentrp
matplotlib
pandas
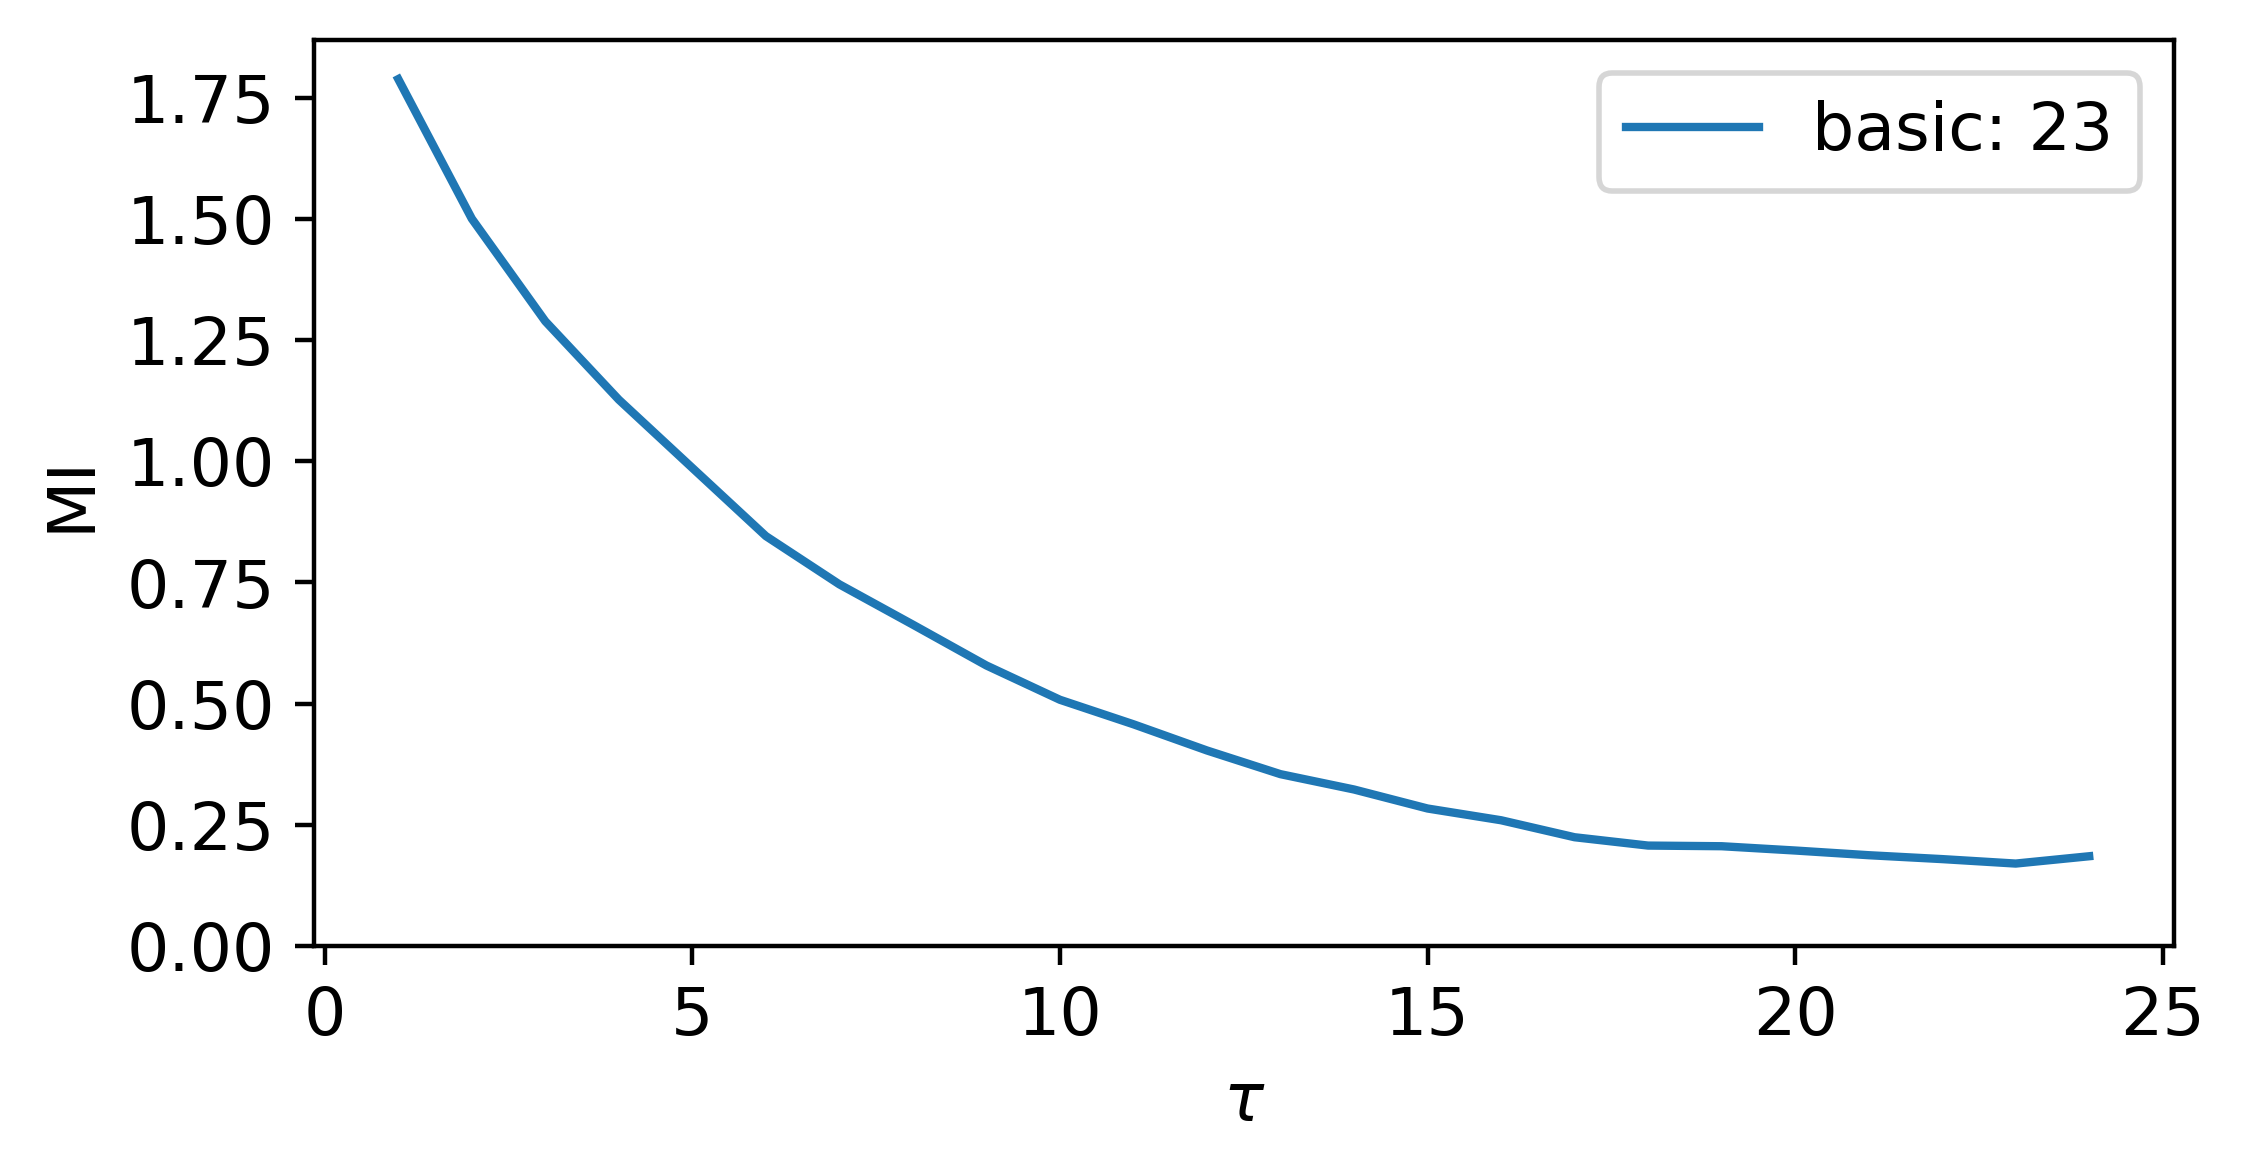
Mutual Information (MI) for time delay (tau).
uses mutual information to find a suitable delay via the location of the first minima in the mutual information vs delay plot, which is calculated using multiple x(t) vs x(t+tau) plots. These plots have their individual mutual information calculated. Various methods for partitioning the x(t) vs x(t+tau) plots for calculating the mutual information.
-
PE_parameter_functions.MI_delay.MI_DV(x, y)¶ This function calculates the mutual information between the time series x(t) and its delayed version x(t+tau) using adaptive partitioning of the plots of the time series x(t) and its delayed version x(t+tau). This method was developed by Georges Darbellay and Igor Vajda in 1999 and was published as Estimation of information by an adaptive partitioning of the observation.
- Parameters
x (array) – time series x(t)
y (array) – delayed time series x(t + tau)
- Returns
I, mutual information between x(t) and x(t+tau).
- Return type
(float)
-
PE_parameter_functions.MI_delay.MI_basic(x, y, h_method='sturge', ranking=True)¶ This function calculates the mutual information between the time series x(t) and its delayed version x(t+tau) using equi-spaced partitions. The size of the partition is based on the desired bin size method commonly selected for histograms.
- Parameters
x (array) – time series x(t)
y (array) – delayed time series x(t + tau)
- Kwargs:
h_method (string): bin size selection method. Methods are struge, sqrt, or rice. Default is sturge.
ranking (bool): whether the ranked or unranked x and y inputs will be used. Default is ranking = True.
- Returns
I, mutual information between x(t) and x(t+tau).
- Return type
(float)
-
PE_parameter_functions.MI_delay.MI_for_delay(ts, plotting=False, method='basic', h_method='sturge', k=2, ranking=True)¶ This function calculates the mutual information until a first minima is reached, which is estimated as a sufficient embedding dimension for permutation entropy.
- Parameters
ts (array) – Time series (1d).
- Kwargs:
plotting (bool): Plotting for user interpretation. defaut is False.
method (string): Method for calculating MI. Options include basic, kraskov 1, kraskov 2, or adaptive partitions. Default is basic.
h_method (string): Bin size selection method for basic method. Methods are struge, sqrt, or rice. Default is sturge.
ranking (bool): Whether the ranked or unranked x and y inputs will be used for kraskov and basic methods. Default is ranking = True.
k (int): Number of nearest neighbors used in MI estimation for Kraskov methods. Default is k = 2.
- Returns
tau, The embedding delay for permutation formation based on first mutual information minima.
- Return type
(int)
-
PE_parameter_functions.MI_delay.MI_kraskov(x, y, k=2, ranking=True)¶ This function estimates the mutual information between the time series x(t) and its delayed version x(t+tau) in two different ways. This method was developed by Alexander Kraskov, Harald Stoegbauer, and Peter Grassberger in 2003 and published as Estimating Mutual Information.
- Parameters
x (array) – time series x(t)
y (array) – delayed time series x(t + tau)
- Kwargs:
k (int): number of nearest neighbors used in MI estimation. Default is k = 2.
ranking (bool): whether the ranked or unranked x and y inputs will be used. Default is ranking = True.
- Returns
I1, first mutual information estimation method between x(t) and x(t+tau). (float): I2, second mutual information estimation method between x(t) and x(t+tau).
- Return type
(float)
The following is an example implementing the MsPE method for selecting both n and tau for permutation entropy:
import numpy as np

fs = 10
t = np.linspace(0, 100, fs*100)
ts = np.sin(t) + np.sin((1/np.pi)*t)

tau = MI_for_delay(ts, plotting = True, method = 'basic', h_method = 'sturge', k = 2, ranking = True)
print('Delay from MI: ',tau)
Where the output for this example is:
Delay from MI: 23
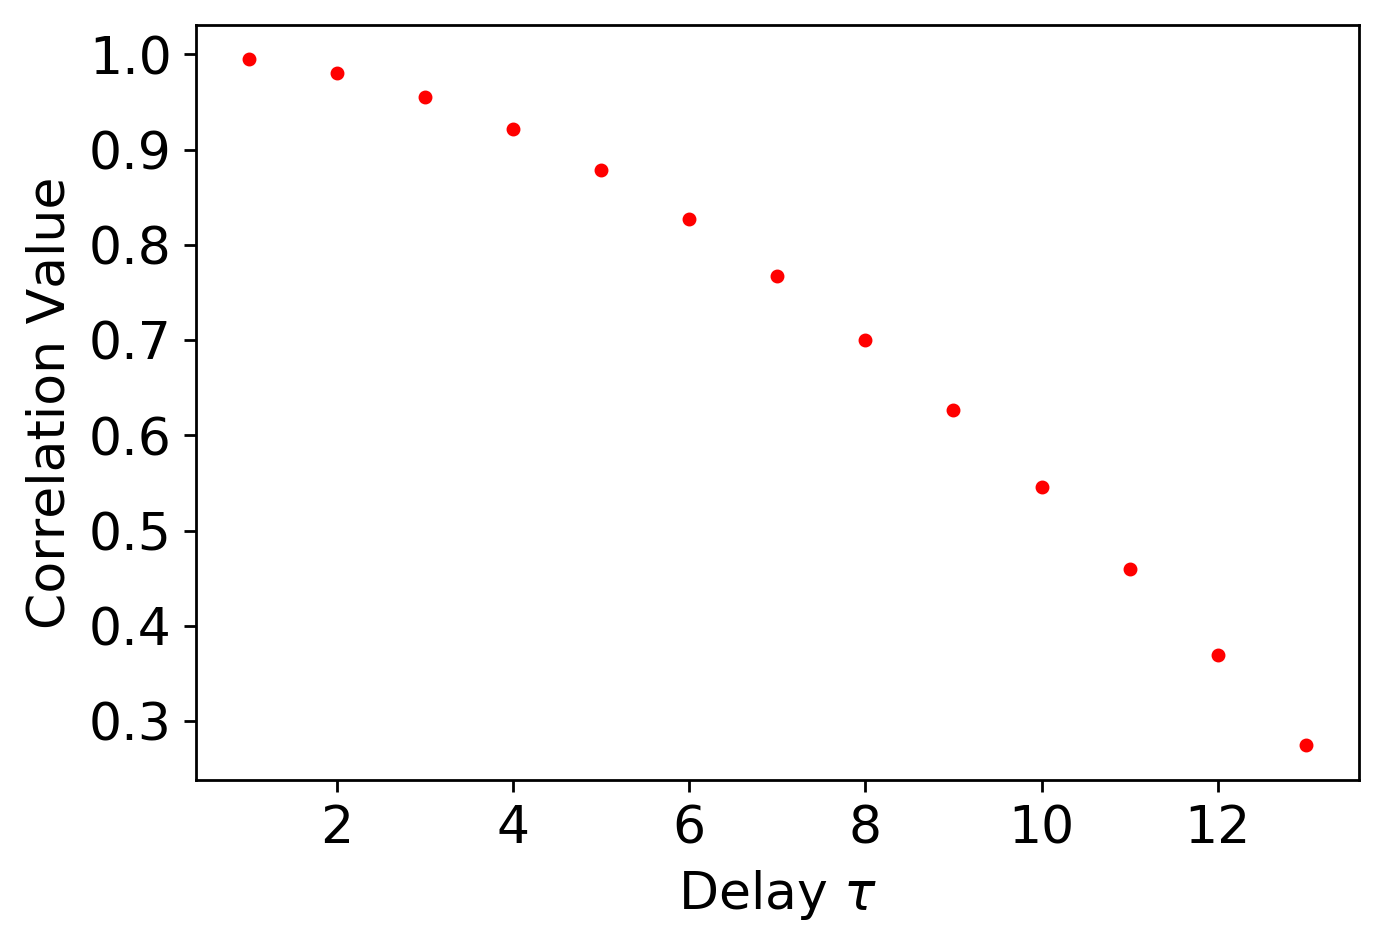
Auto-correlation for time delay (tau).
This function implements Auto-Correlation (AC) for the selection of the delay tau for permutation entropy. Additionally, it only requires a single time series and has a fast computation time. However, this method is only designed for linear system.
-
PE_parameter_functions.autocorrelation.autoCorrelation_tau(ts, cutoff=0.36788, AC_method='spearman', plotting=False)¶ This function takes a time series and uses AC to find the optimum delay based on the correlation being less than a specified cutoff (default is 1/e, which is approximately 0.36788).
- Parameters
ts (array) – Time series (1d).
cutoff (float) – value for which correlation is considered insignificant (default is 1/e).
method (string) – either ‘spearman’ or ‘pearson’. default is ‘spearman’.
- Kwargs:
plotting (bool): Plotting for user interpretation. defaut is False.
- Returns
tau, The embedding delay for permutation formation.
- Return type
(int)
The following is an example implementing autocorrelation for selecting tau for permutation entropy:
import numpy as np
import matplotlib.pyplot as plt
from scipy.integrate import odeint
from PE_parameter_functions import autocorrelation

t = np.linspace(0, 100, 1000)
ts = np.sin(t)

Delay = autocorrelation.autoCorrelation_tau(ts, cutoff = 1/np.exp(1), AC_method = 'pearson', plotting = True)
#calculates delay from autocorrelation (Pearson's)

print('Delay from AC: ', Delay)
Where the output for this example is:
Delay from AC: 13
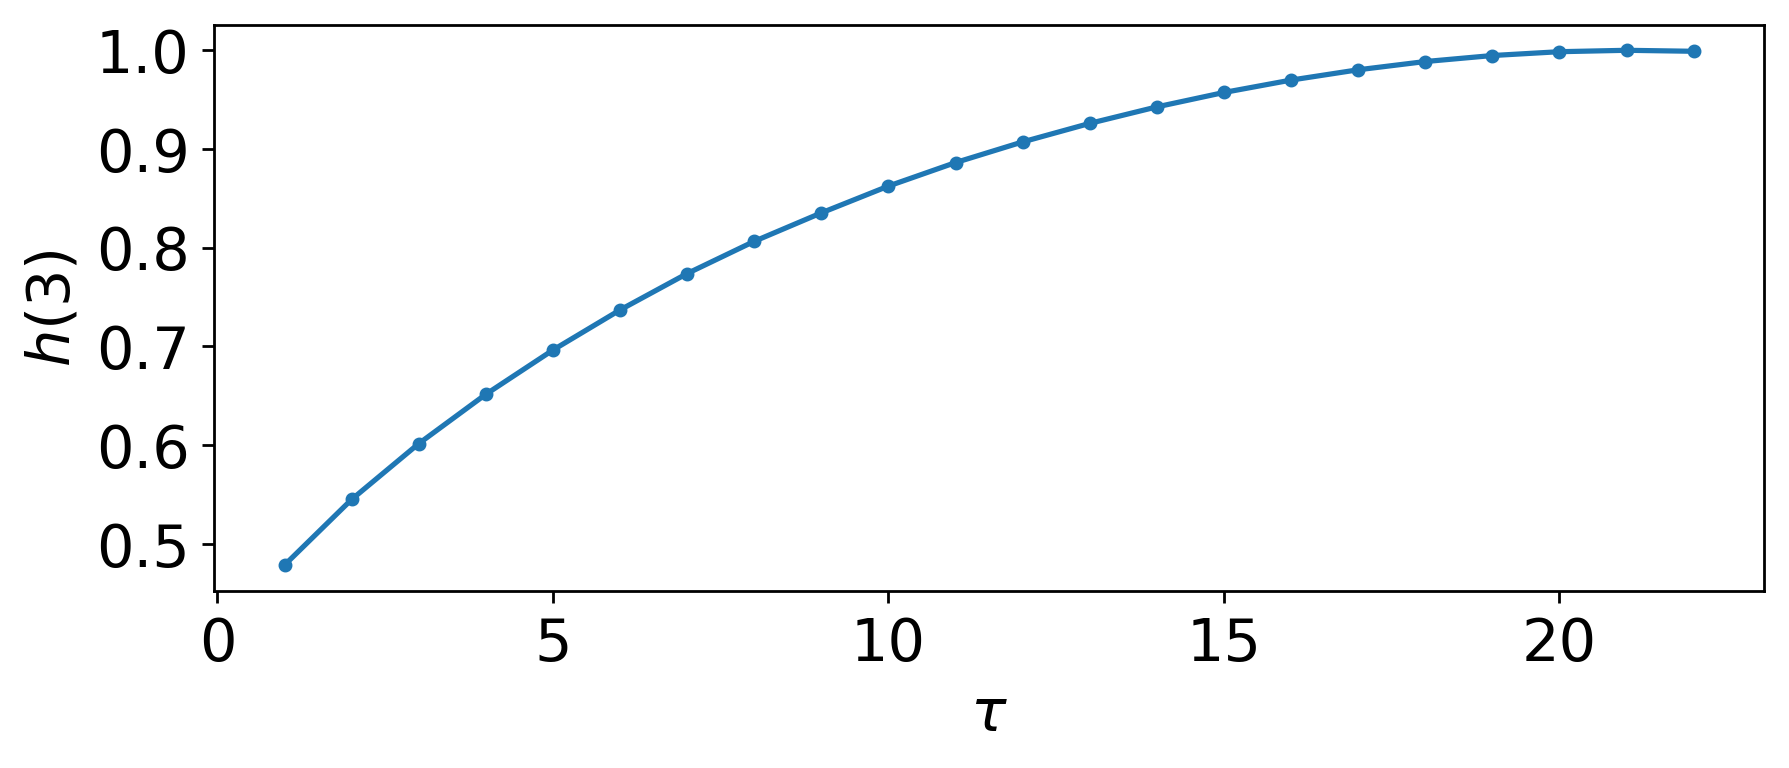
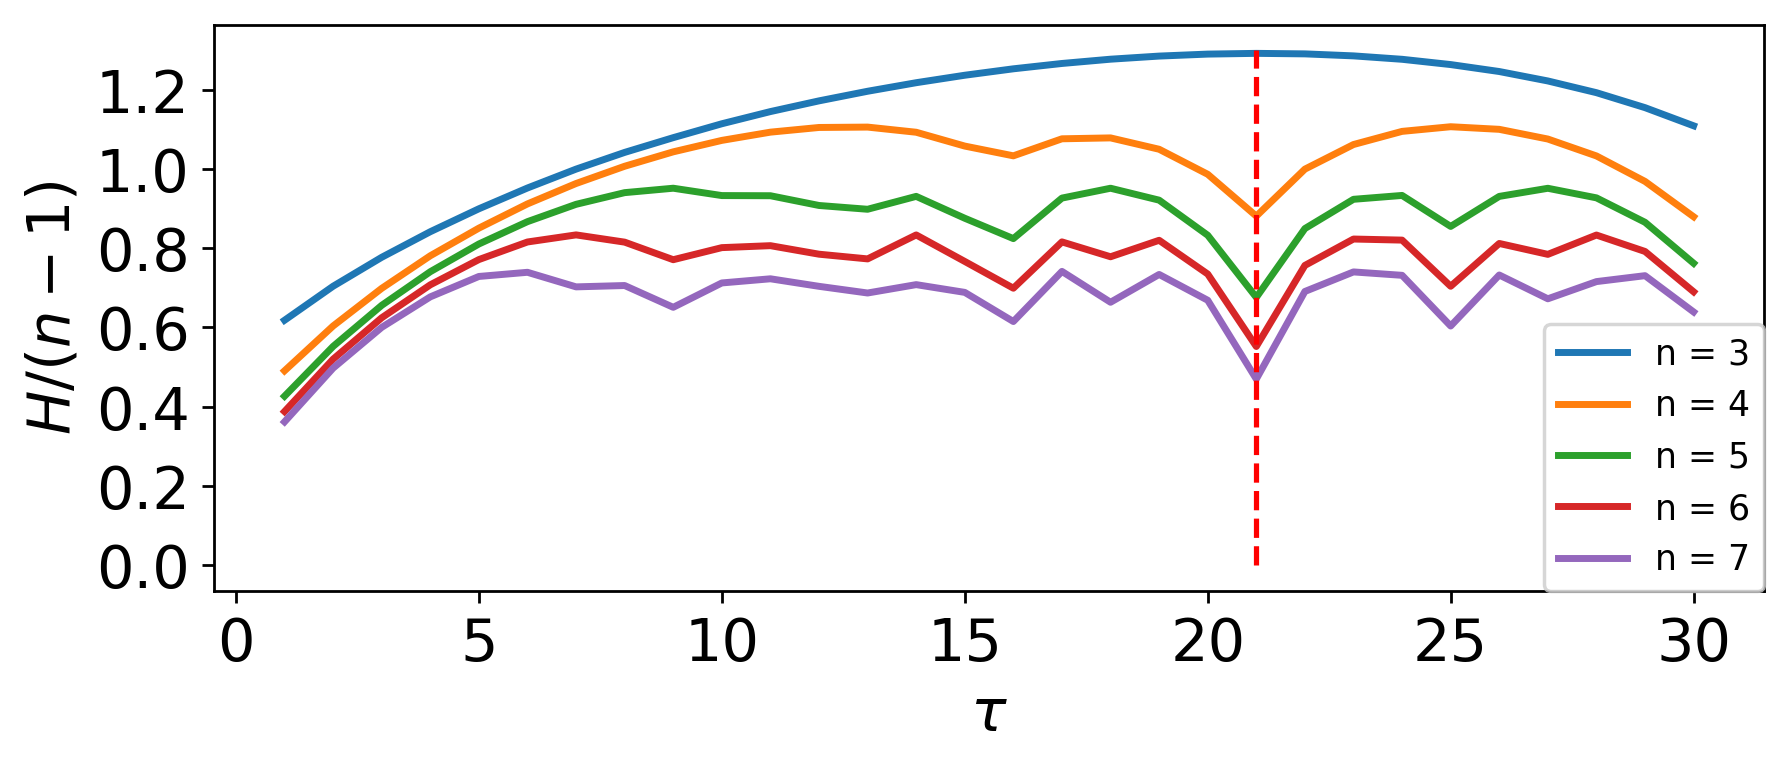
MsPE for time delay (tau) and dimension (n).
This function implements Multi-scale Permutation Entropy (MsPE) for the selection of n and tau for permutation entropy. Additionally, it only requires a single time series, is robust to additive noise, and has a fast computation time.
-
PE_parameter_functions.MsPE.MsPE_n(time_series, delay, m_start, m_end, plotting=False)¶ This function returns a suitable embedding dimension, given a time series and embedding delay, based on the dimenion normalized MsPE at the optimum delay for a range of dimensions n.
- Parameters
ts (array) – Time series (1d).
delay (int) – Optimum delay from MsPE.
m_start (int) – minimum dimension in dimension search. Default is 3.
m_end (int) – maximum dimension in dimension search. Default is 8.
- Kwargs:
plotting (bool): Plotting for user interpretation. defaut is False.
- Returns
n, The embedding dimension for permutation formation.
- Return type
(int)
-
PE_parameter_functions.MsPE.MsPE_tau(time_series, delay_end=200, plotting=False)¶ This function takes a time series and uses Multi-scale Permutation Entropy (MsPE) to find the optimum delay based on the first maxima in the MsPE plot
- Parameters
ts (array) – Time series (1d).
delay_end (int) – maximum delay in search. default is 200.
- Kwargs:
plotting (bool): Plotting for user interpretation. defaut is False.
- Returns
tau, The embedding delay for permutation formation.
- Return type
(int)
The following is an example implementing the MsPE method for selecting both n and tau for permutation entropy:
import numpy as np
import matplotlib.pyplot as plt
from PE_parameter_functions import MsPE

t = np.linspace(0, 100, 1000)
ts = np.sin(t)

m_s, m_e, d_s, d_e = 3, 7, 1, 200
#m_s and m_e are the starting and ending dimensions n to search through
#d_e = max delay tau to search through

#plotting option will show you how delay tau or dimension n were selected
tau = int(MsPE.MsPE_tau(ts, d_e, plotting = True))
n = MsPE.MsPE_n(ts, tau, m_s, m_e, plotting = True)

print('Embedding Delay:       '+str(tau))
print('Embedding Dimension:   '+str(n))
Where the output for this example is:
Embedding Delay:       21
Embedding Dimension:   3
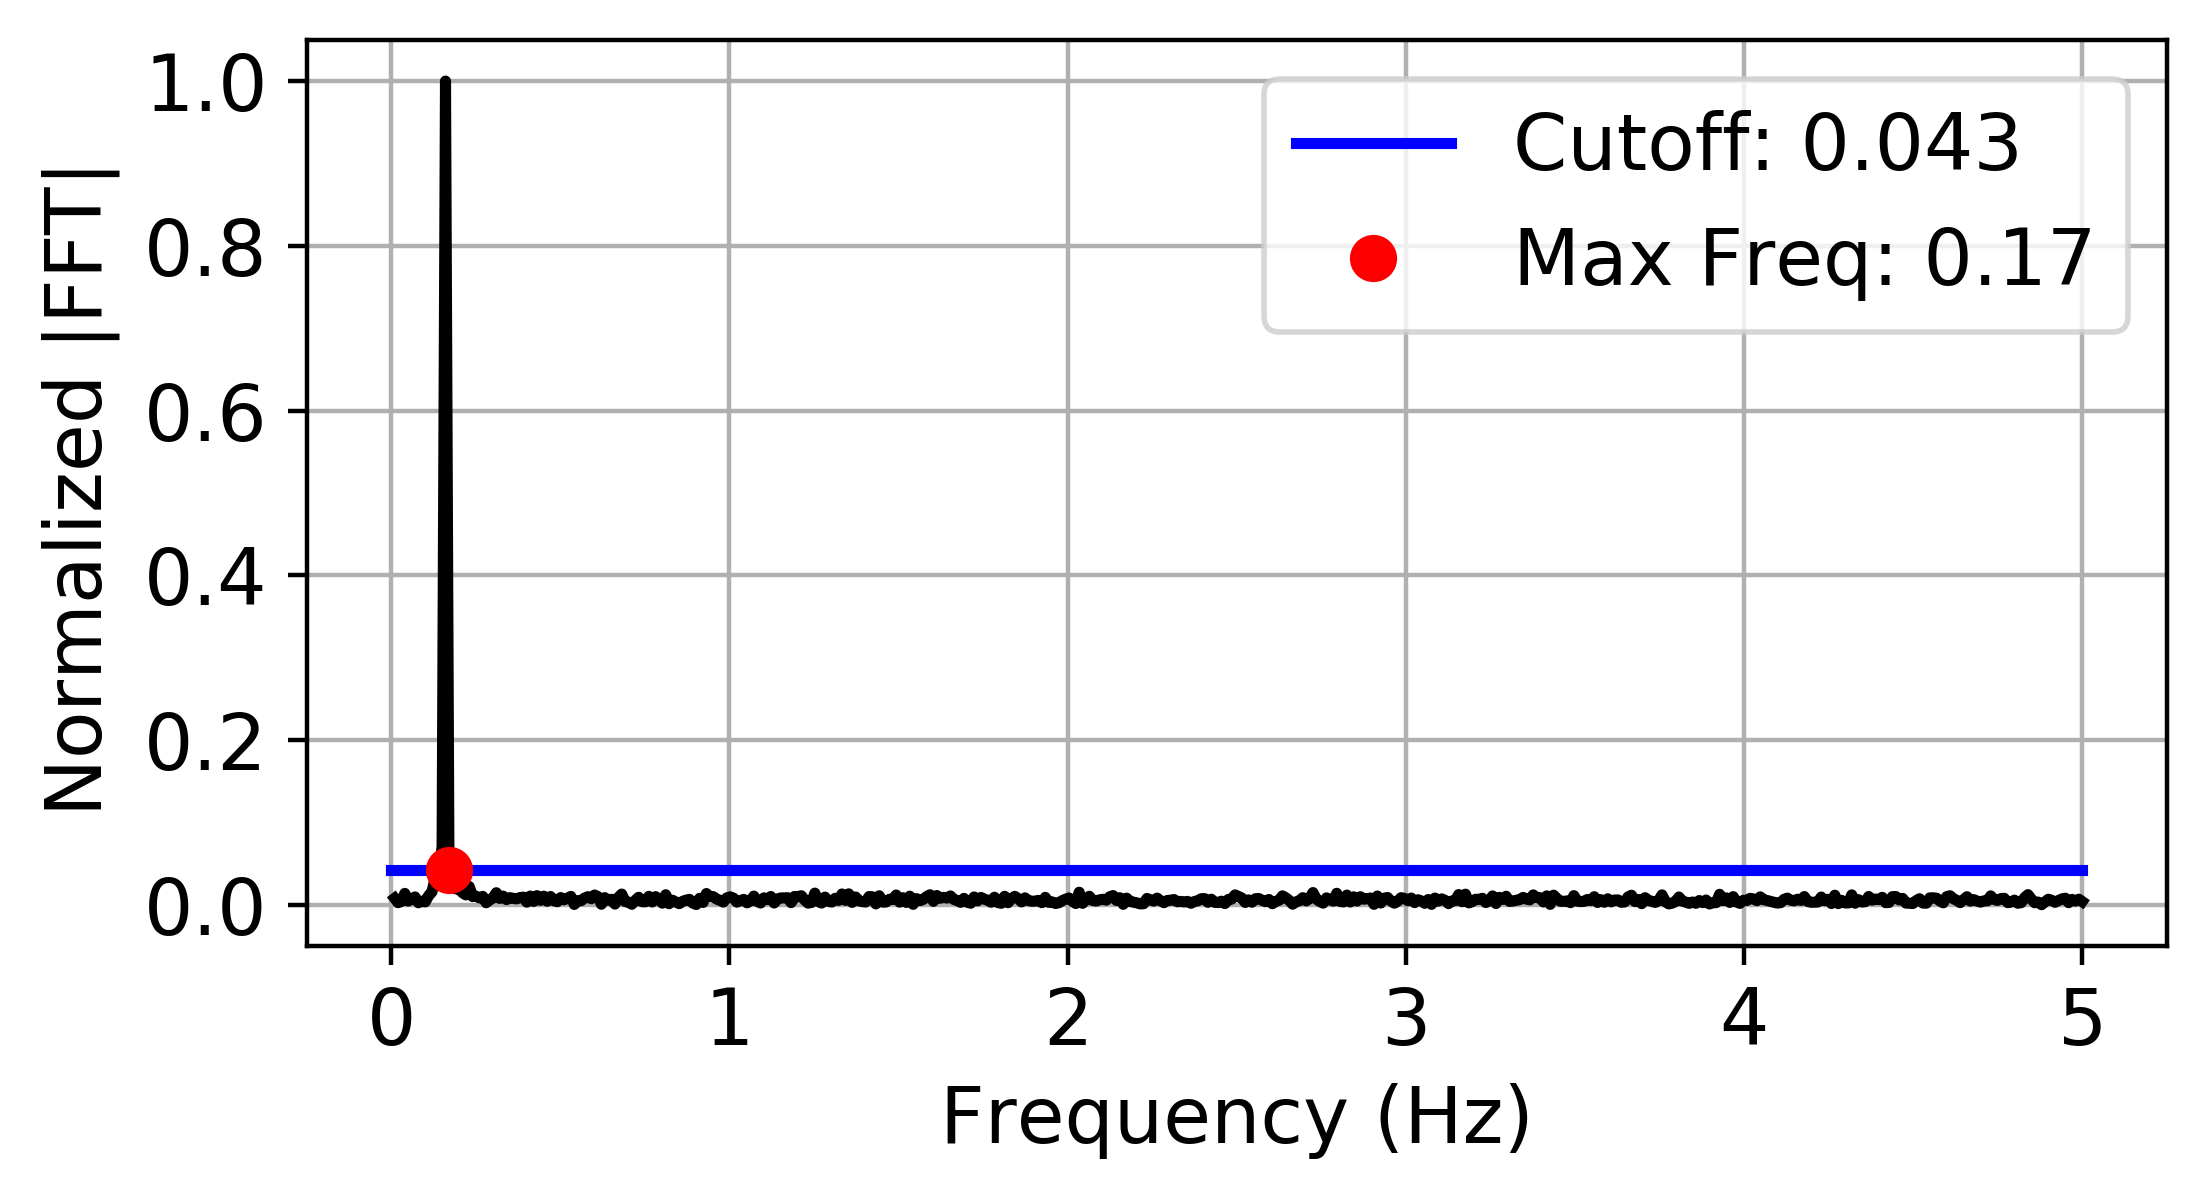
Statistical analysis of the Fourier spectrum for time delay (tau).
This function a statistical analysis (using the least median of squares) of the fourier spectrum (FFT) from a time series to detect the greatest signficant frequency, which is then used to select the delay (tau) from the samping rate criteria developed in On the 0/1 test for chaos in continuous systems by Melosik and Marszalek.
-
PE_parameter_functions.delay_LMS.AbsFFT(ts, fs)¶ This function returns the maximum frequency in fourier spectrum given a cutoff threshold.
- Parameters
ts (array) – Time series (1d).
fs – Sampling frequency of time series (equispaced).
-
PE_parameter_functions.delay_LMS.LMSforDelay(ts, fs, plotting=False)¶ This function takes a time series (ts) and the sampling frequency (fs) and uses the fast fourier transform and gaussian noise statistics in the fourier spectrum (using least median of squares (LMS) in statistical analysis) to determine a suitable embedding delay for permutation entropy using the theory developed in On the 0/1 test for chaos in continuous systems by Melosik and Marszalek.
- Parameters
ts (array) – Time series (1d).
fs (float) – Sampling frequency of time series (equispaced).
- Kwargs:
plotting (bool): Plotting for user interpretation. defaut is False.
- Returns
tau, The embedding delay for permutation formation.
- Return type
(int)
-
PE_parameter_functions.delay_LMS.MaximumFrequency(xf, yf, cutoff)¶ This function returns the maximum frequency in fourier spectrum given a cutoff threshold.
- Parameters
xf (array) – frequency array from FFT.
yf (array) – normalized FFT values.
- Returns
maxfreq, the maximum frequency above threshold in fourier spectrum.
- Return type
(float)
The following is an example implementing the statistics of gaussian noise in the fourier spectrum and the sampling criteria from On the 0/1 test for chaos in continuous systems by Melosik and Marszalek for selecting tau for permutation entropy:
import numpy as np

fs = 10
t = np.linspace(0, 100, fs*100)
ts = np.sin(t) + np.random.normal(0,0.1, len(t))

tau = LMSforDelay(ts, fs, plotting = True)
print('Permutation Embedding Delay: ' + str(int(tau)))
Where the output for this example is:
Permutation Embedding Delay: 19
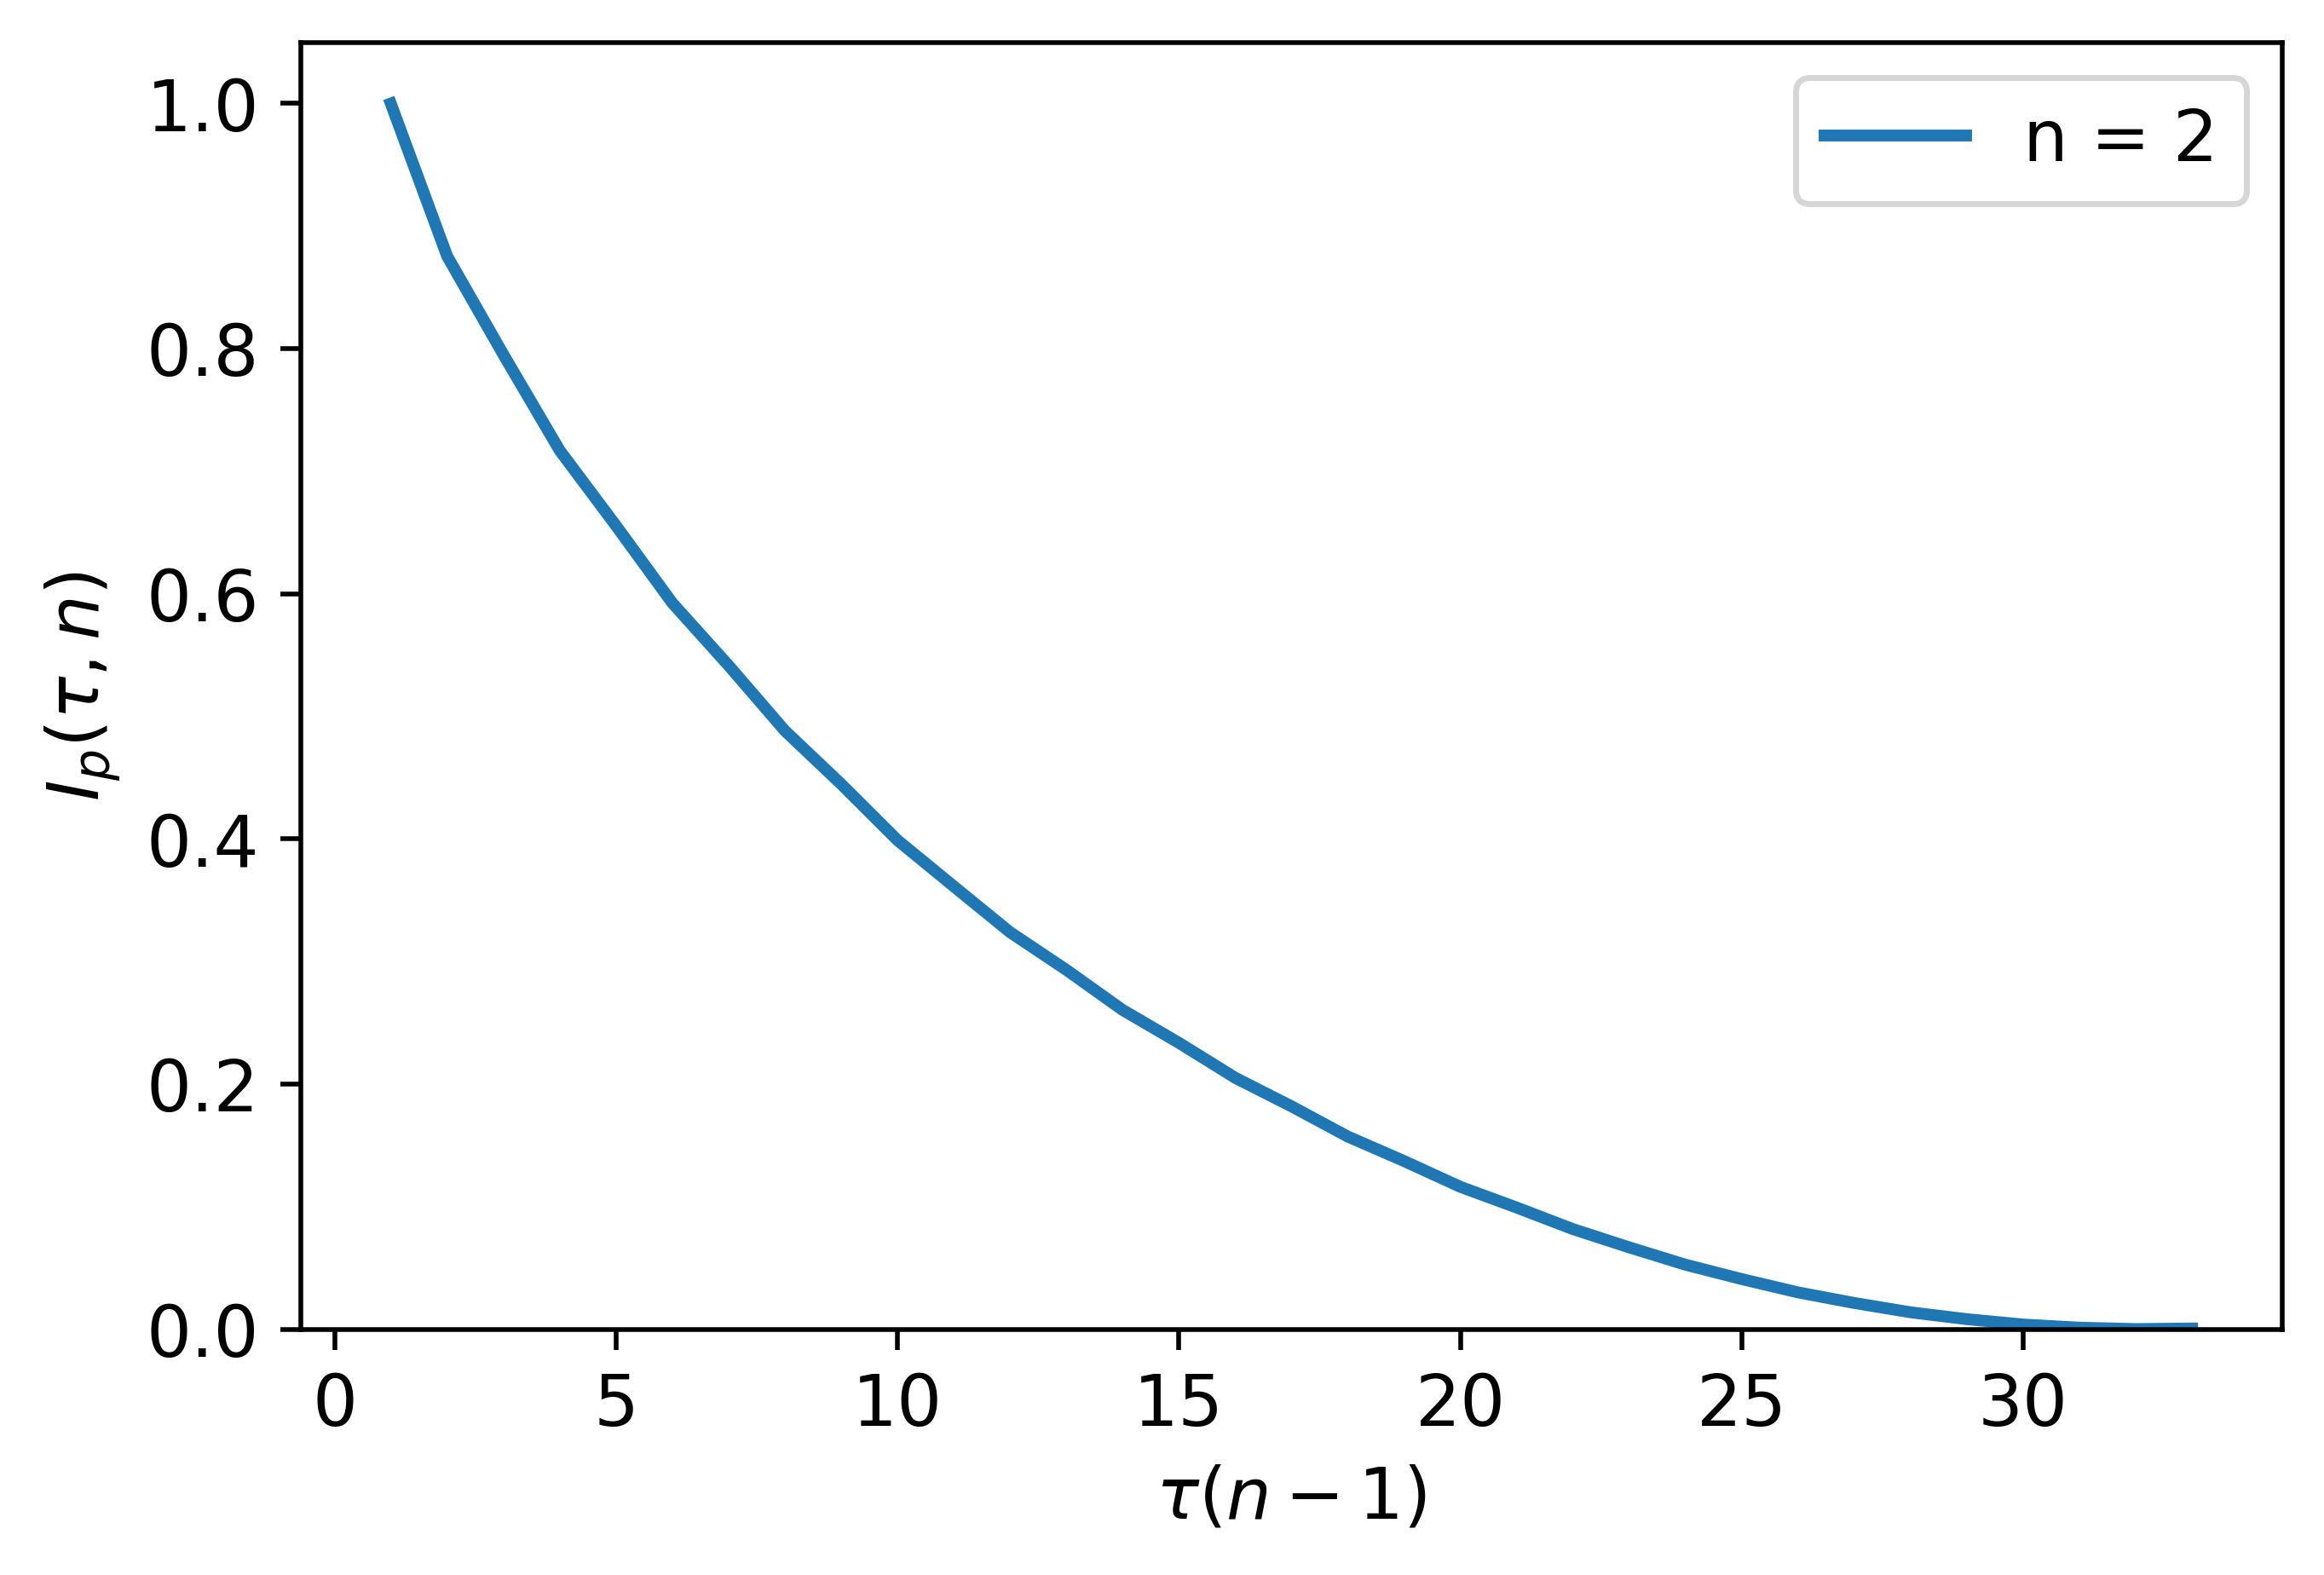
Permutation Auto Mutual Information (PAMI) for time delay (tau).
This function implements the mulutal information of permutations to find the delay (tau) that causes the first minima in the mutual information between permutations.
-
PE_parameter_functions.PAMI_delay.PAMI_for_delay(ts, n=5, plotting=False)¶ This function calculates the mutual information between permutations with tau = 1 and tau = delay
- Parameters
ts (array) – Time series (1d).
- Kwargs:
plotting (bool): Plotting for user interpretation. defaut is False.
n (int): dimension for calculating delay. delault is 5 as explain in On the Automatic Parameter Selection for Permutation Entropy
- Returns
tau, The embedding delay for permutation formation.
- Return type
(int)
-
PE_parameter_functions.PAMI_delay.mutualPerm(ts, delay, n)¶ This function calculates the mutual information between permutations with tau = 1 and tau = delay
- Parameters
ts (array) – Time series (1d).
delay (int) – Permutation delay
n (int) – Permutation dimension
- Returns
I, Mutual permutation information.
- Return type
(float)
The following is an example implementing Permutation Auto-Mutual Information for the purpose of selecting the permutation delay for permutation entropy:
import numpy as np

fs = 10
t = np.linspace(0, 100, fs*100)
ts = np.sin(t)
tau = PAMI_for_delay(ts, n = 5, plotting = True)
print('Delay from PAMI: ',tau)
Where the output for this example is:
Permutation Embedding Delay: 8
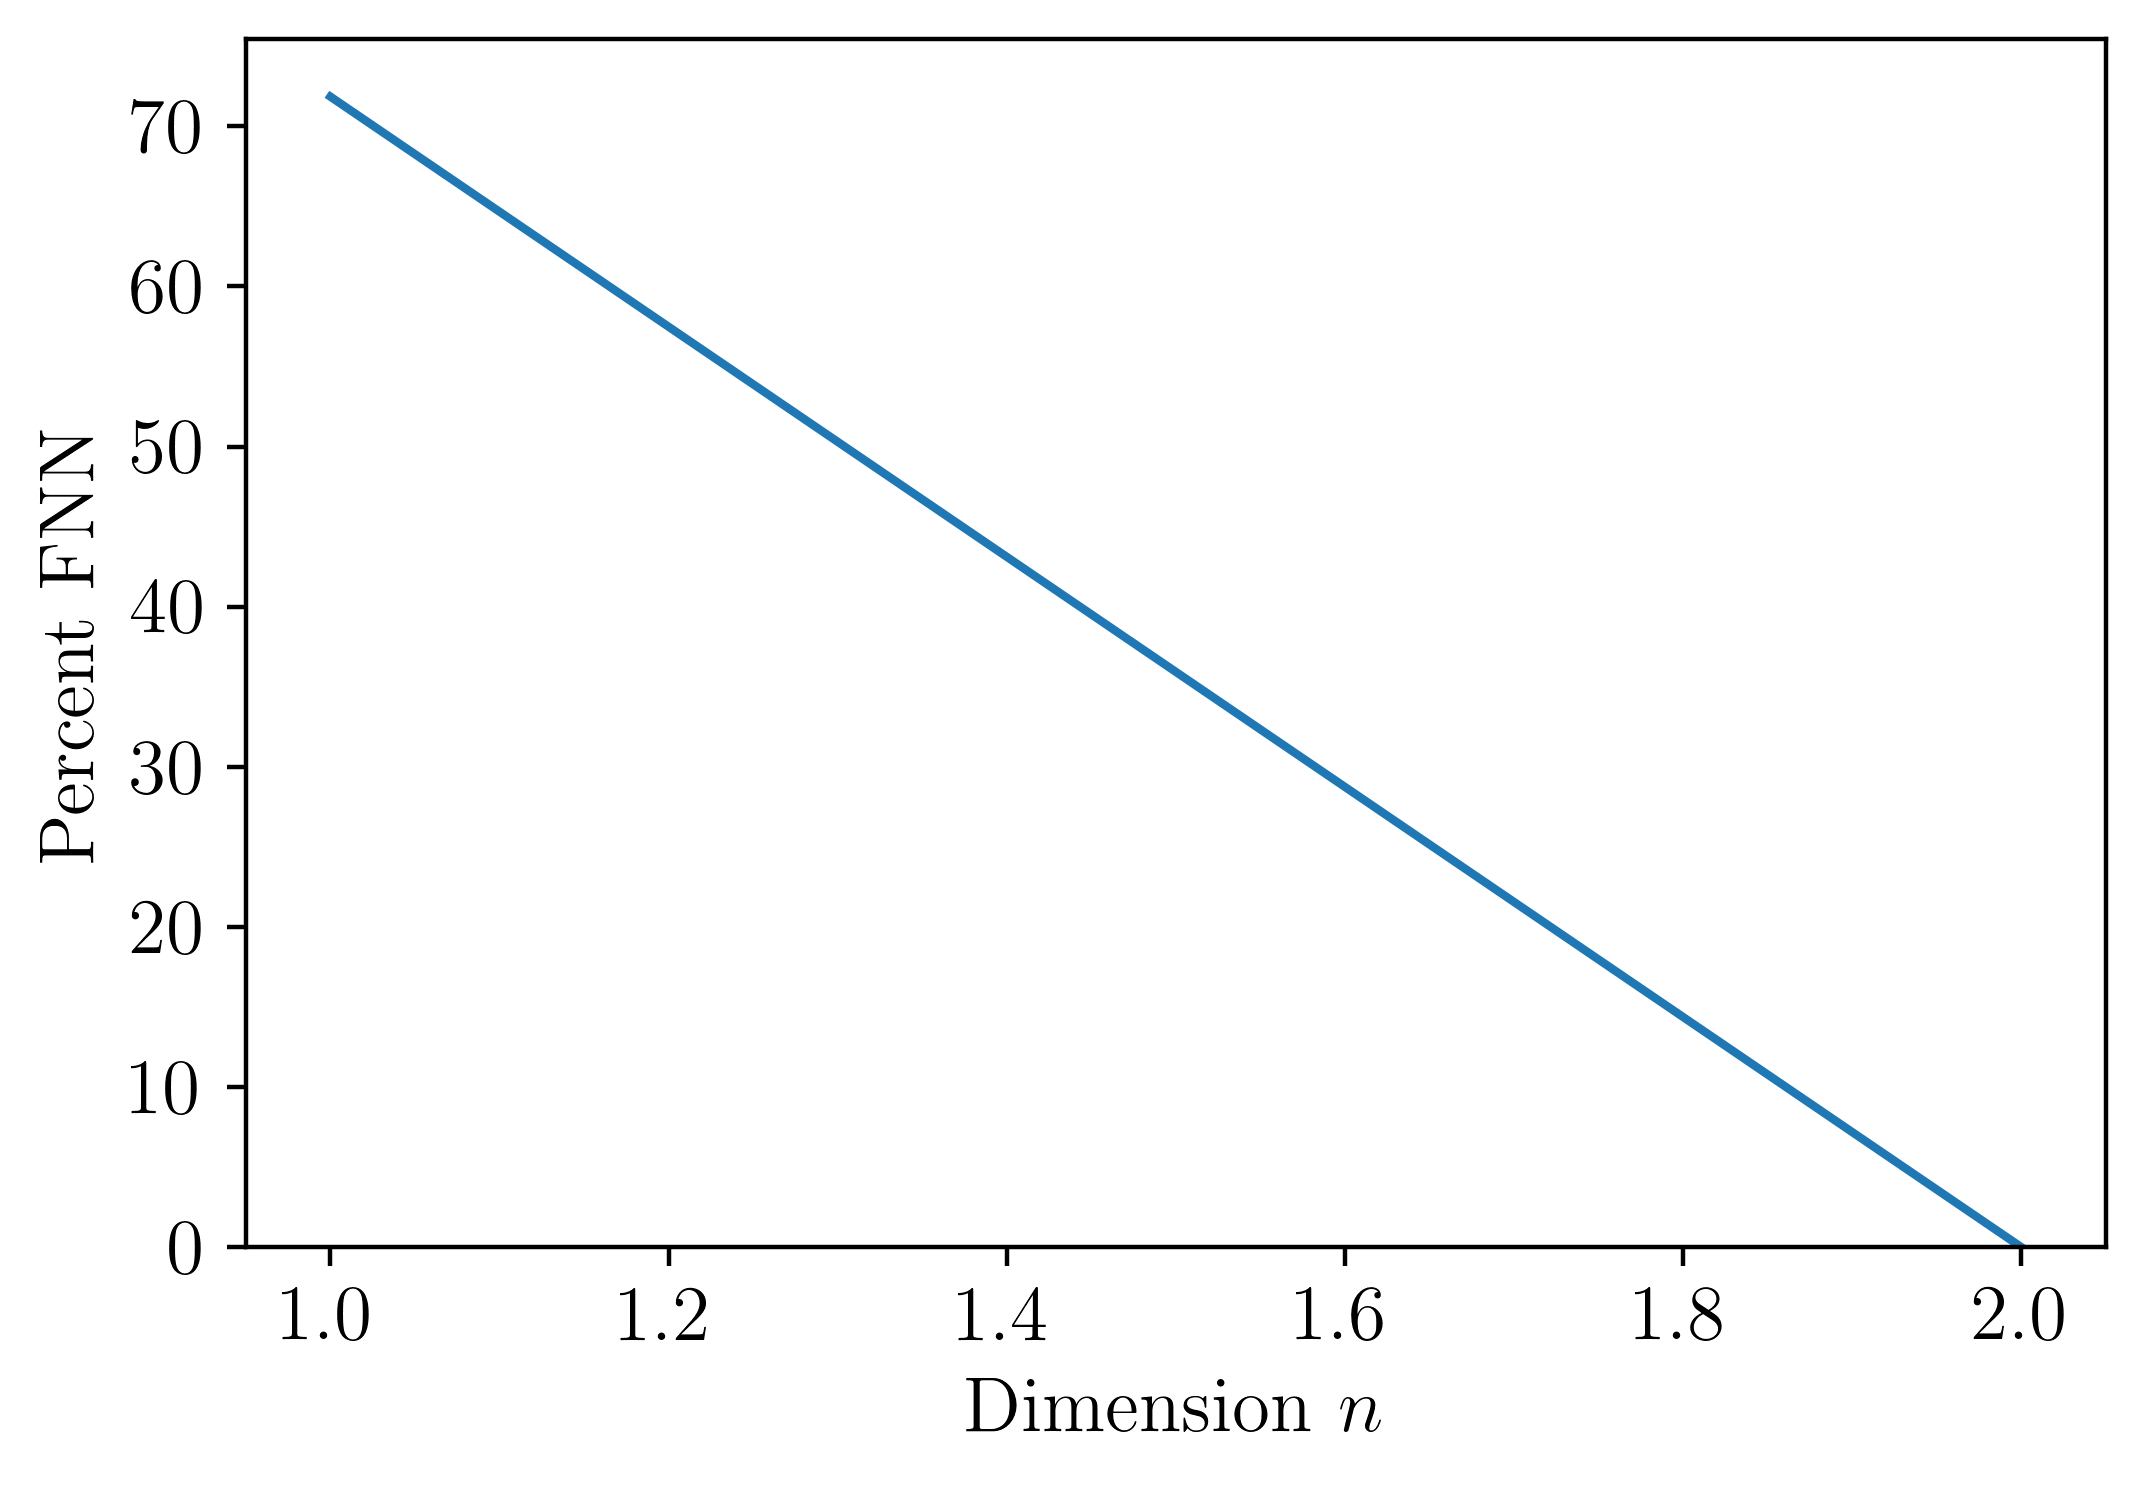
False Nearest Neighbors (FNN) for dimension (n).
-
PE_parameter_functions.FNN_n.FNN_n(ts, tau, maxDim=10, plotting=False, Rtol=15, Atol=2, threshold=10)¶ This function implements the False Nearest Neighbors (FNN) algorithm described by Kennel et al. to select the minimum embedding dimension.
- Parameters
ts (array) – Time series (1d).
tau (int) – Embedding delay.
- Kwargs:
maxDim (int): maximum dimension in dimension search. Default is 10.
plotting (bool): Plotting for user interpretation. Defaut is False.
Rtol (float): Ratio tolerance. Defaut is 15.
Atol (float): A tolerance. Defaut is 2.
threshold (float): Tolerance threshold for percent of nearest neighbors. Defaut is 10.
- Returns
n, The embedding dimension.
- Return type
(int)
The following is an example implementing the False Nearest Neighbors (FNN) algorithm for the permutation dimension:
import numpy as np

fs = 10
t = np.linspace(0, 100, fs*100)
ts = np.sin(t)

tau=15 #embedding delay

perc_FNN, n =FNN_n(ts, tau, plotting = True)
print('FNN embedding Dimension: ',n)
Where the output for this example is:
FNN embedding Dimension: 2